Interactive Visualization Systems Laboratory
Our goal is to provide data-forward interactive visualization systems to help readers dive deep into high-quality data and enable deep, human-focused analysis. Our work focuses on creating tools and systems that allow for readers to explore questions about data in clear and straightforward ways.
Weather Data with Historical Context for Your Location

Temperature Radials
A data-forward radial visualization of the historical temperature record of every large city in America.

Historic Snowfall and Snow Depth
A data-forward exploration of historic snowfall and snow depth across 5,000 cities in the United States.
91-DIVOC Project: COVID-19 Visualizations

91-DIVOC
A project to explore the global growth of COVID-19. Updated daily with data directly from multiple sources including Johns Hopkins University and Our World In Data.

COVID-19 Data for Locations of People You Love
A project to display COVID-19 data only for the locations that matter most to you. Updated daily with data for every county in the United States.

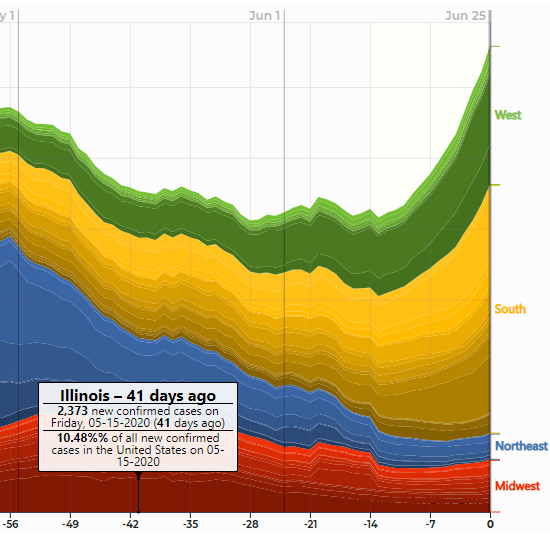
Coronavirus Contribution by State
Visualizing each state's contribution to coronavirus pandemic in the United States.

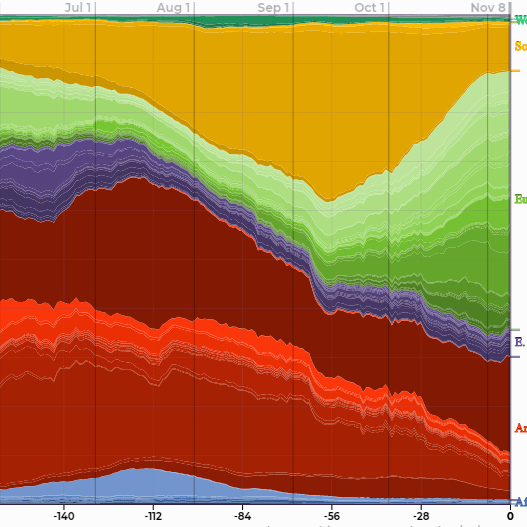
Coronavirus Contribution by Country
Visualizing each country's contribution to coronavirus pandemic in the world.

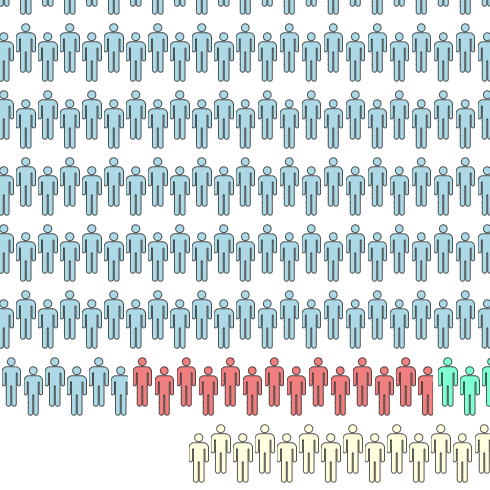
Coronavirus Visualized as a 1,000-Person Community
Experimental visualization exploring COVID-19 data as members of a small community. Updated daily.

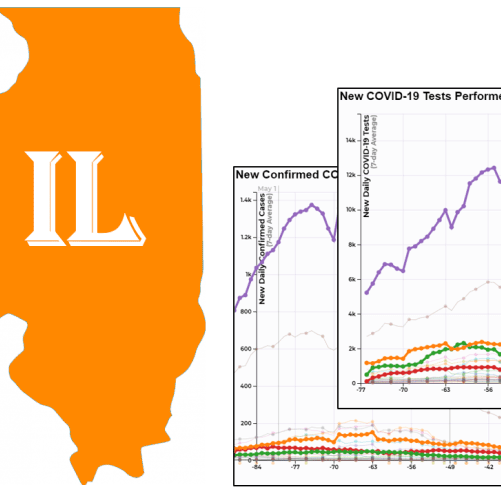
Interactive Visualization of COVID-19 in Illinois
Data-forward visualization of COVID-19 data in Illinois. Updated daily from the Illinois Department of Public Health (IDPH).
Select Earlier Visualizations Work
Courses and GPA Visualizations
- Grade disparity between sections at UIUC
- GPAs of Every Course at The University of Illinois
- Every Gen Ed at UIUC, by GPA
- The Grainger Engineering Metro Map
Diversity Visualizations
- Gender Diversity of Course Instructors at Illinois
- Gender Diversity at UIUC
- Racial Demographics at UIUC